Measuring images
PyJAMAS provides tools to quantify annotated images. PyJAMAS can measure images currently open in the application, and it can also analyze images in batch mode for comparison of annotated datasets.
Measuring individual annotation files
Open an image and the corresponding annotation file.
To measure the annotated objects, select Measure polylines … from the Measurement menu.
Choose the measurements and the slices to include in the calculations, and select a file to save the results. The options available in Measure polylines … are:
area: units are pixels.
perimeter: units are pixels.
pixel values: quantifies the mean pixel values at the perimeter and inside of each polyline.
image stats: calculates the mean and mode pixel values for each of the selected slices.
The measurements are saved as a CSV file, and can be opened using a spreadsheet or a text editor, as well as imported into Python (e.g. by using the read_csv function in the data processing package Pandas) for further processing and visualization.
Batch measurements
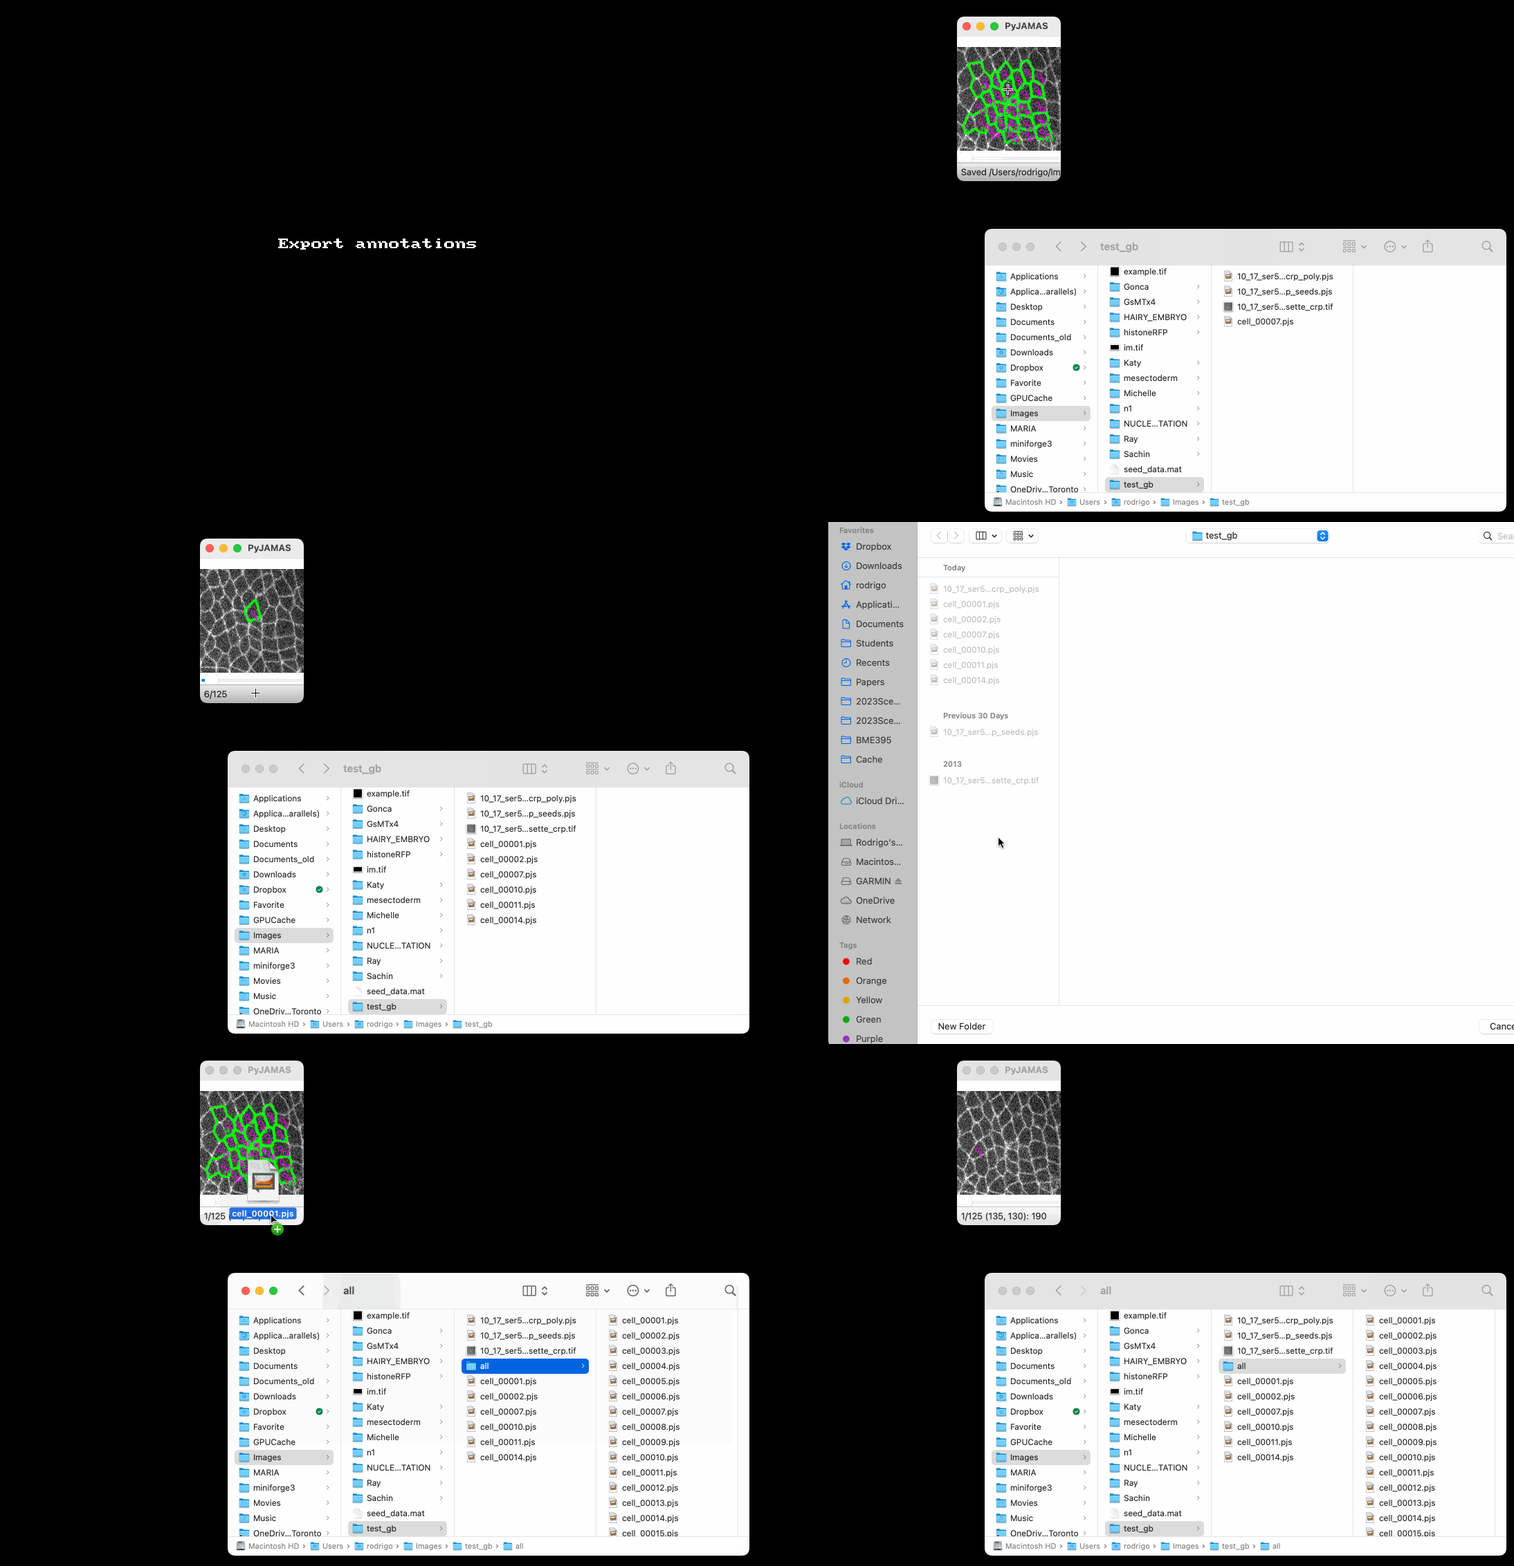
Organize imaging data files and their corresponding annotation files into folders. Create a folder for all data belonging to one experimental condition (for example, control). Within this folder, create a subfolder for each of the individual images belonging to the group. In each subfolder, place the grayscale image and the corresponding annotation file (or files, in case multiple structures are to be measured in an image). Make sure to include one annotation file per structure to be analyzed (e.g. one file per cell). The option to Export individual fiducial-polyline annotations in the IO menu can be used to export individual annotation files per tracked structure by clicking on a fiducial inside the corresponding polyline. The option Export ALL fiducial-polyline annotations … will export all the available polylines tracked with fiducials into individual annotation files in a folder. Fiducials may be automatically added to the interior of each polyline using Add seeds in polyline centroids … in the Image menu. Fiducials can then be automatically tracked.
Select the Measure … option from the Batch menu. In the dialog, specify the parameters for the data group(s) to be analyzed. The analysis can be executed (with run analysis) without plotting the results. Similarly, once the analysis has been executed, the results can be plotted (with plot results) without re-running the analysis, thus saving time. The different options in the Measure dialog are:
time resolution: the number of seconds between each slice for the analysis of time-lapse sequences.
xy resolution: pixel size in microns.
images before treatment: the number of slices in a time-lapse sequence before a treatment was applied. Set to zero if no treatment was applied.
brush size: the width of the line used to measure the pixel values under polylines.
analyze image intensities: if selected, not only morphological features (area, perimeter, circularity) but also pixel values will be quantified.
image extension: the extension of the images in each subfolder.
intensity normalization: correct for photobleaching (by dividing by the mean image intensity), background (subtracting the image mode, or the mode of the region of the image occupied by the sample if there are empty regions) and photobleaching correction (as before, or restricting the calculation of the image mean to the pixels covered by the sample), or no normalization (none). There is also a file-based normalization option that uses a file with the same name as the image being corrected and PyJAMAS.backgroundimage_extension (.bg). The file contains an image with one slice or as many slices as the image being analyzed. This background image is used to correct for background and photobleaching. If the file-based option is selected but the background image is not found, the analysis reverts to using the mode and mean of the image under analysis.
analysis file name suffix: suffix to add to the file used to store the analysis results (in csv format).
analysis file name extension: extension of the analysis files used to store the analysis results.
error style: for plots displaying the mean of a measurement over time, the standard error of the mean will be displayed as a band or as individual error bars.
plot style: for plots showing the distribution of data across multiple experiments within a group, a box plot or a violin plot can be selected.
run analysis: if selected, measurements are re-done (slower). Otherwise, previous measurement results are used.
save analysis results: if selected, generates and saves a csv file containing the combined results of the analysis of all the images and a Jupyter notebook that allows reproducing the analysis and interactively plotting the results. The results will be saved in the results folder. The Jupyter notebook file name will consist of the date and time when the analysis was conducted, followed by the notebook suffix.
plot results: if selected, generates and saves all figures (slower).
The measurements for each annotation file are saved as a CSV file in the folder containing the annotation file. Overall results are saved (in csv, notebook, and/or figure format) in the results folder.
Image annotations and analysis results can be imported into Python for custom analyses and visualization.
NOTES ON INTERACTIVE JUPYTER NOTEBOOKS
The analysis of image batches in PyJAMAS can generate interactive Jupyter notebooks. Interactivity in Jupyter notebooks relies on ipywidgets, a package installed with PyJAMAS. Please, check the ipywidgets documentation if you have issues with interactivity in notebooks (e.g. there are no interactive features). Most often the following steps are sufficient to fix any issues:
Download and install the Nodejs JavaScript runtime.
Open a new terminal and execute the following command for JupyterLab:
$ jupyter labextension install @jupyter-widgets/jupyterlab-manager
or this one for Jupyter Notebook:
$ jupyter nbextension enable --py widgetsnbextension
Reopen your Jupyter server.
